UPDATE & DISCLAIMER: Please note that all the data below are for all language schools, not just those that only teach ESL. By using “eikaiwa” as a shorthand for all survey respondents, I am assuming that the dominance of English as the second language of choice (and the apparent overwhelming share that English occupies in the classroom-style language teaching market) and therefore that these numbers are essentially not affected by other languages. It is entirely possible, but unknowable from this set of data, that for any of these measures, the breakdown by language could show, for example, that the growth of Korean and Chinese language schools has made those languages a bigger driver of trends.
(First-time readers – I recommend reading my previous post on this topic “English teaching in Japan by the numbers” to get an idea of where this data is coming from)
You can now use Google Documents to see the data I used to create charts in my previous post, Eikaiwa by the numbers. In future data-oriented posts I hope to use the same tool.
While I’ve got you, here are a couple more views of the eikaiwa school data. As I mention toward the bottom, amid all the woeful news are a few rays of hope – the level of new students has remained relatively stable, and sales per customer have actually risen to a recent (if not historic) high:
Number of students

The student population went from 5.18% of the Japanese population in 2000 to 3.54% in 2008.
Student/teacher ratio

In a very wide estimate, each teacher last year taught 19% fewer students than the teachers at the turn of the century. One has to wonder how this ratio works out – maybe student numbers include people who just come in for two lessons and quit?
Classes taught
Also, the total number of classes started the decade at around 10.6 million, peaked at around 14 million in 2004, and fell to just 6.18 million in 2008.
Classes per teacher
Each teacher on average taught 645 classes in 2008, down 31% from 2000 and 42% from the 2005 peak of 1,107.
Number of eikaiwa schools
The number of schools, meanwhile, grew from 3,139 in 2000 to 3,680 (with a spike of 4,303 along the way in 2006).
Sales per teacher

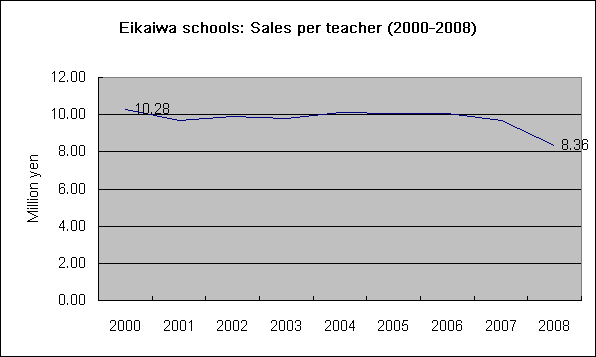
Each teacher now brings in 18.6% less raw revenue than in 2000, in line with the student/teacher ratio.
Sales per student
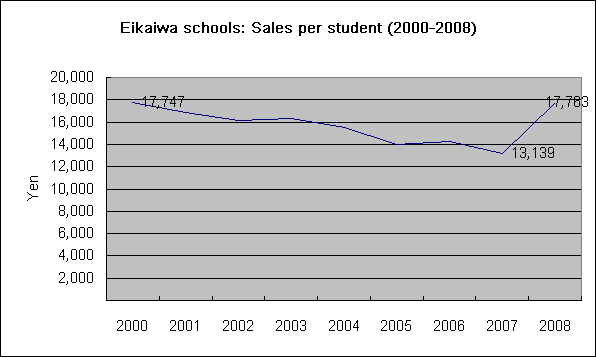
 Oddly, the sales per student bounced back in 2008 to more than the figure in 2000! Either there is some sort of time lag or carry-over effect in the data (receipts do not accurately reflect the student numbers given for the same year) or the schools found some way to boost the sales per student, though apparently not improving sales per teacher.
Sales per class
The total sales per class taught increased:
Sales per eikaiwa school
However, this is not reflected in the sales per school, despite the increase in the number of schools:
Conclusion
Every measure seems to be heading downward for the eikaiwa classroom industry, except for sales per student and sales per class taught. If we note that the number of new students has not seen the same level of collapse as areas like sales, total number of students, and number of teachers, this would seem to indicate that the students who have remained are willing to pay more for the privilege.


